

A verdict, a chart and a year.
This is an educational walkthrough using a fictional family. It is not financial advice, and the right answers for you depend on facts a lesson cannot know.
Watch this lesson (4 minutes) Opens YouTube in a new tab.
1.How do I read my answer?
You have a plan now, and a page full of numbers. Today we learn to read it. There are only three things to look at. As always: this is an educational walkthrough using a fictional family. It isn’t financial advice.
2.Three things to look at
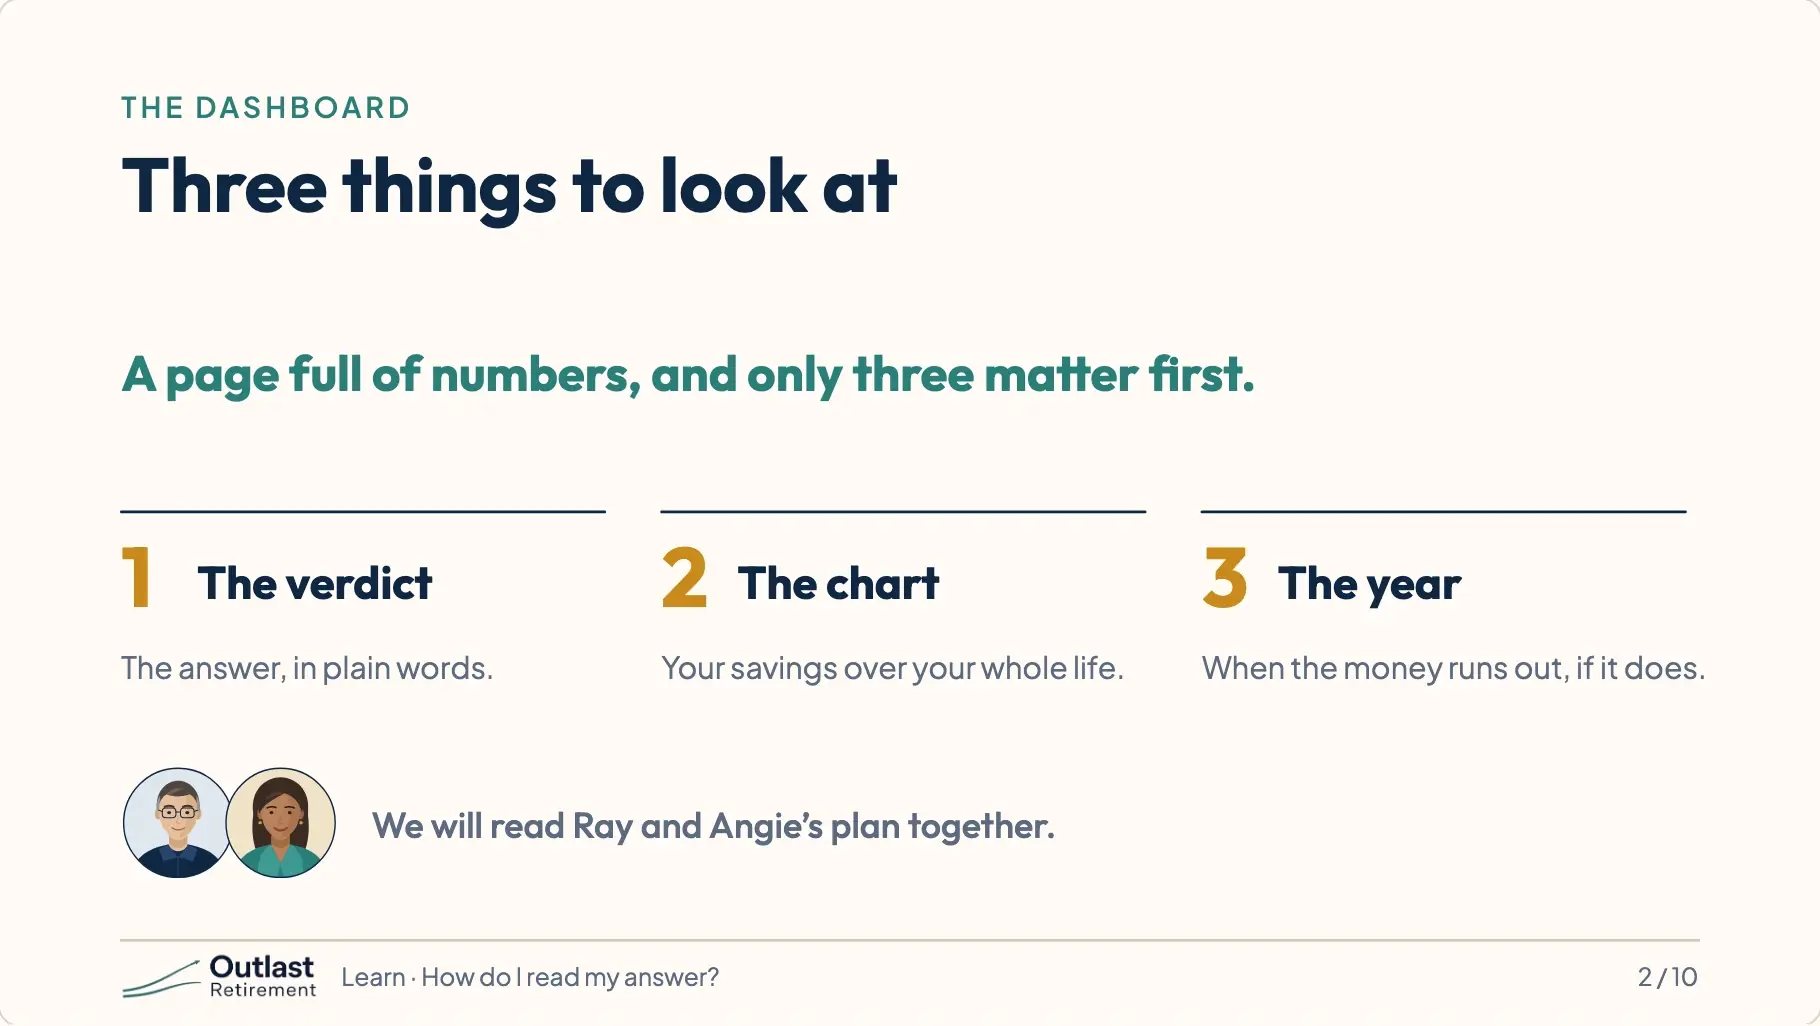
The verdict, in words. The chart, a picture of your savings over your whole life. And the year, when the money runs out, if it does. We will use Ray and Angie’s plan so you can follow along.
3.The answer, in plain words
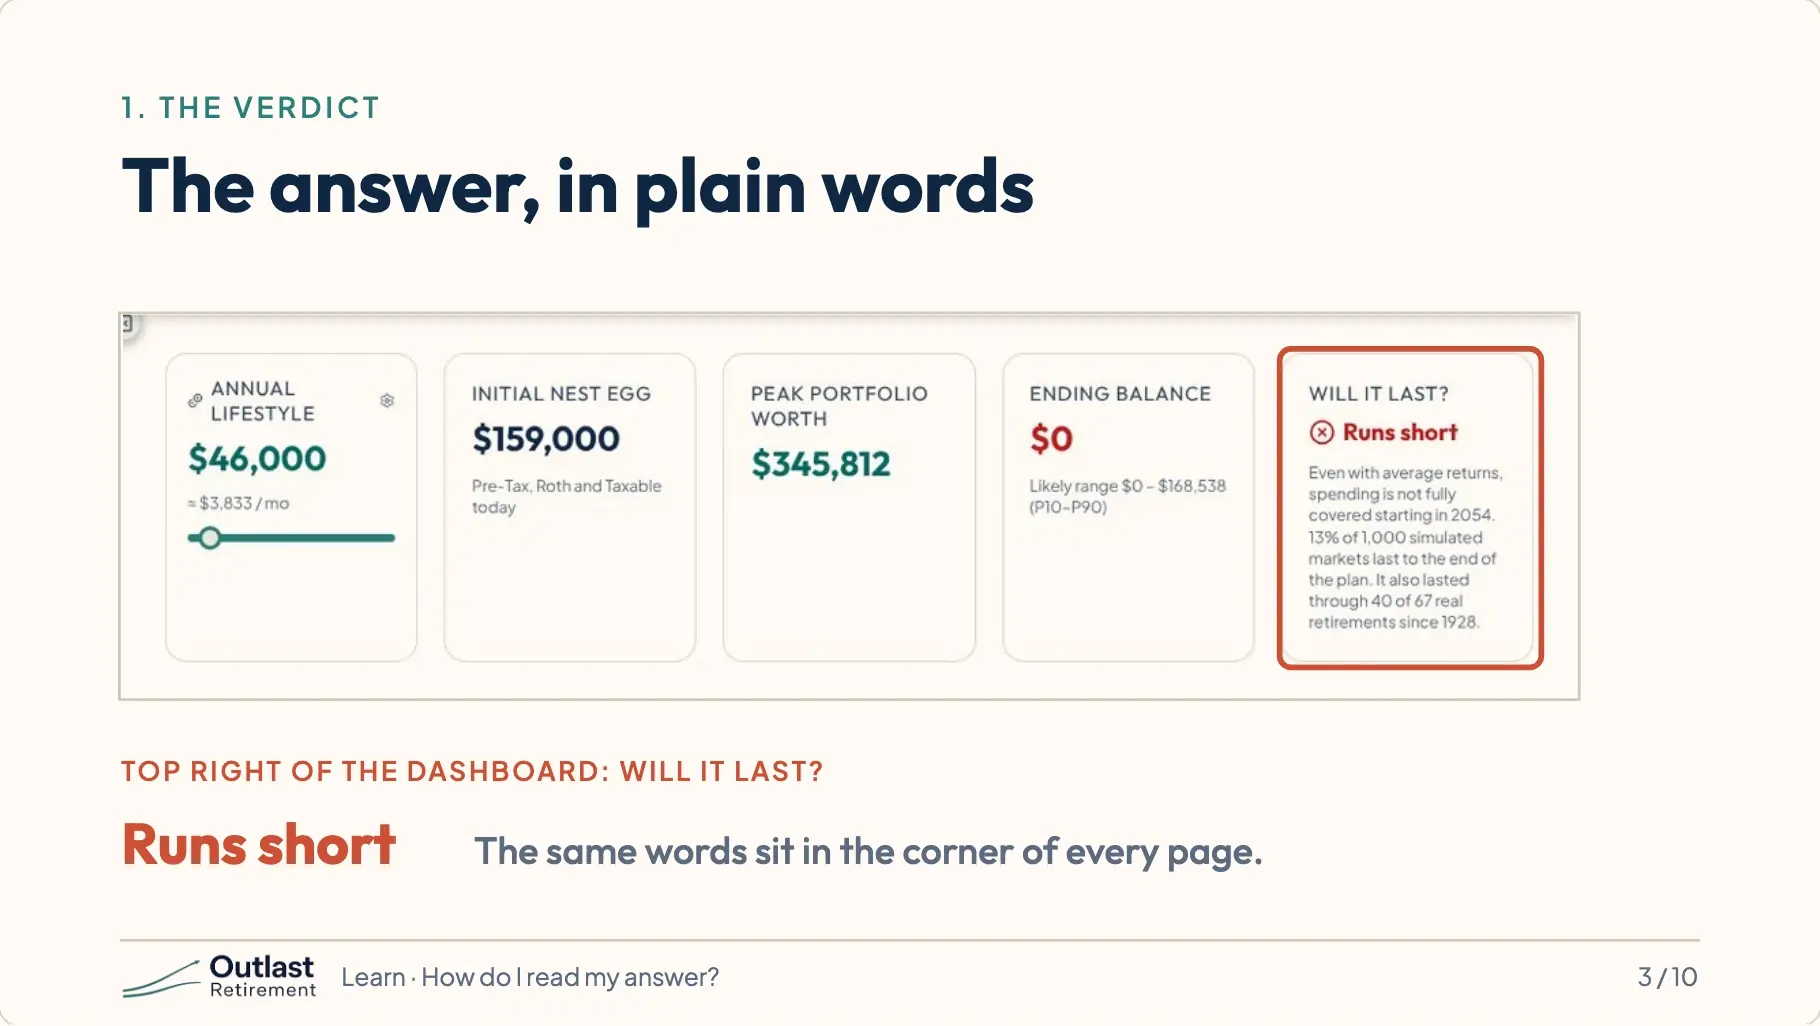
Start at the top right. This card answers the question in plain words. Ray and Angie’s says runs short. Yours might say on track, mostly on track, at risk, or runs short. You will see the same words in the corner of every page, so you always know where you stand.
4.What the words mean
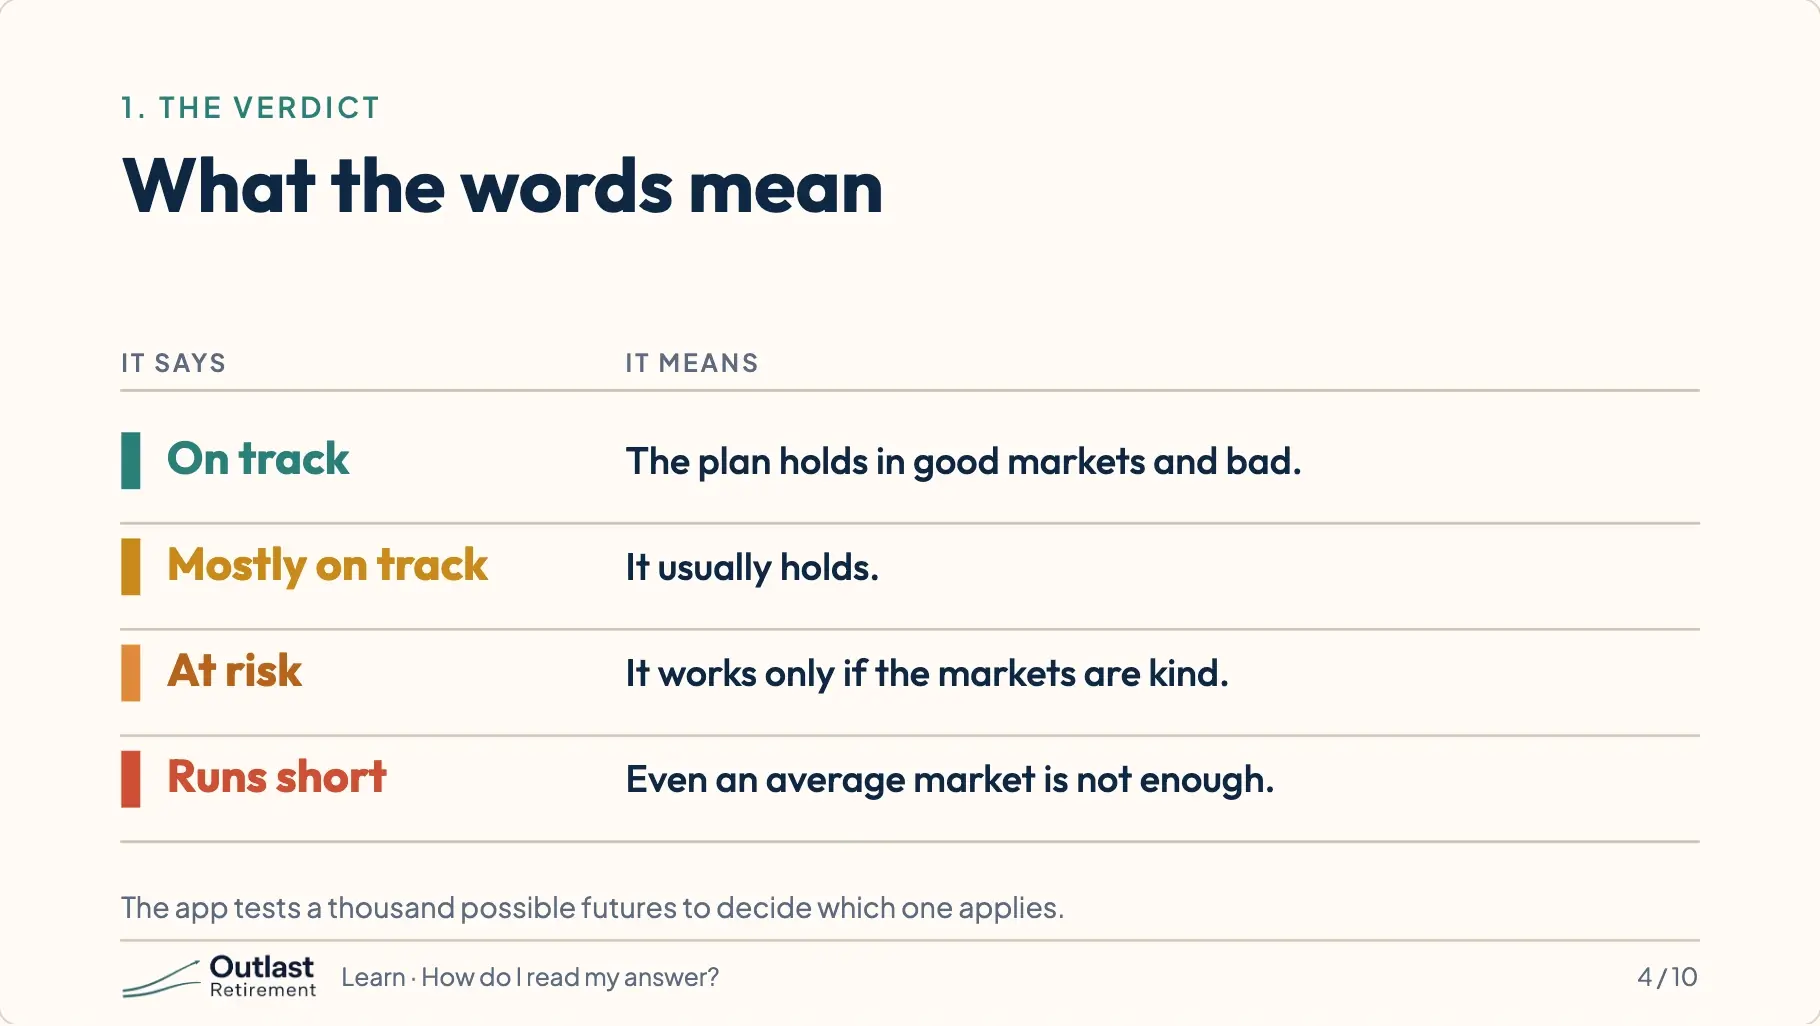
On track means the plan holds up in good markets and bad. Mostly on track means it usually does. At risk means it only works if the markets are kind. Runs short means that even in an average market, the money ends before you do.
5.Left is today. Right is the rest of your life.
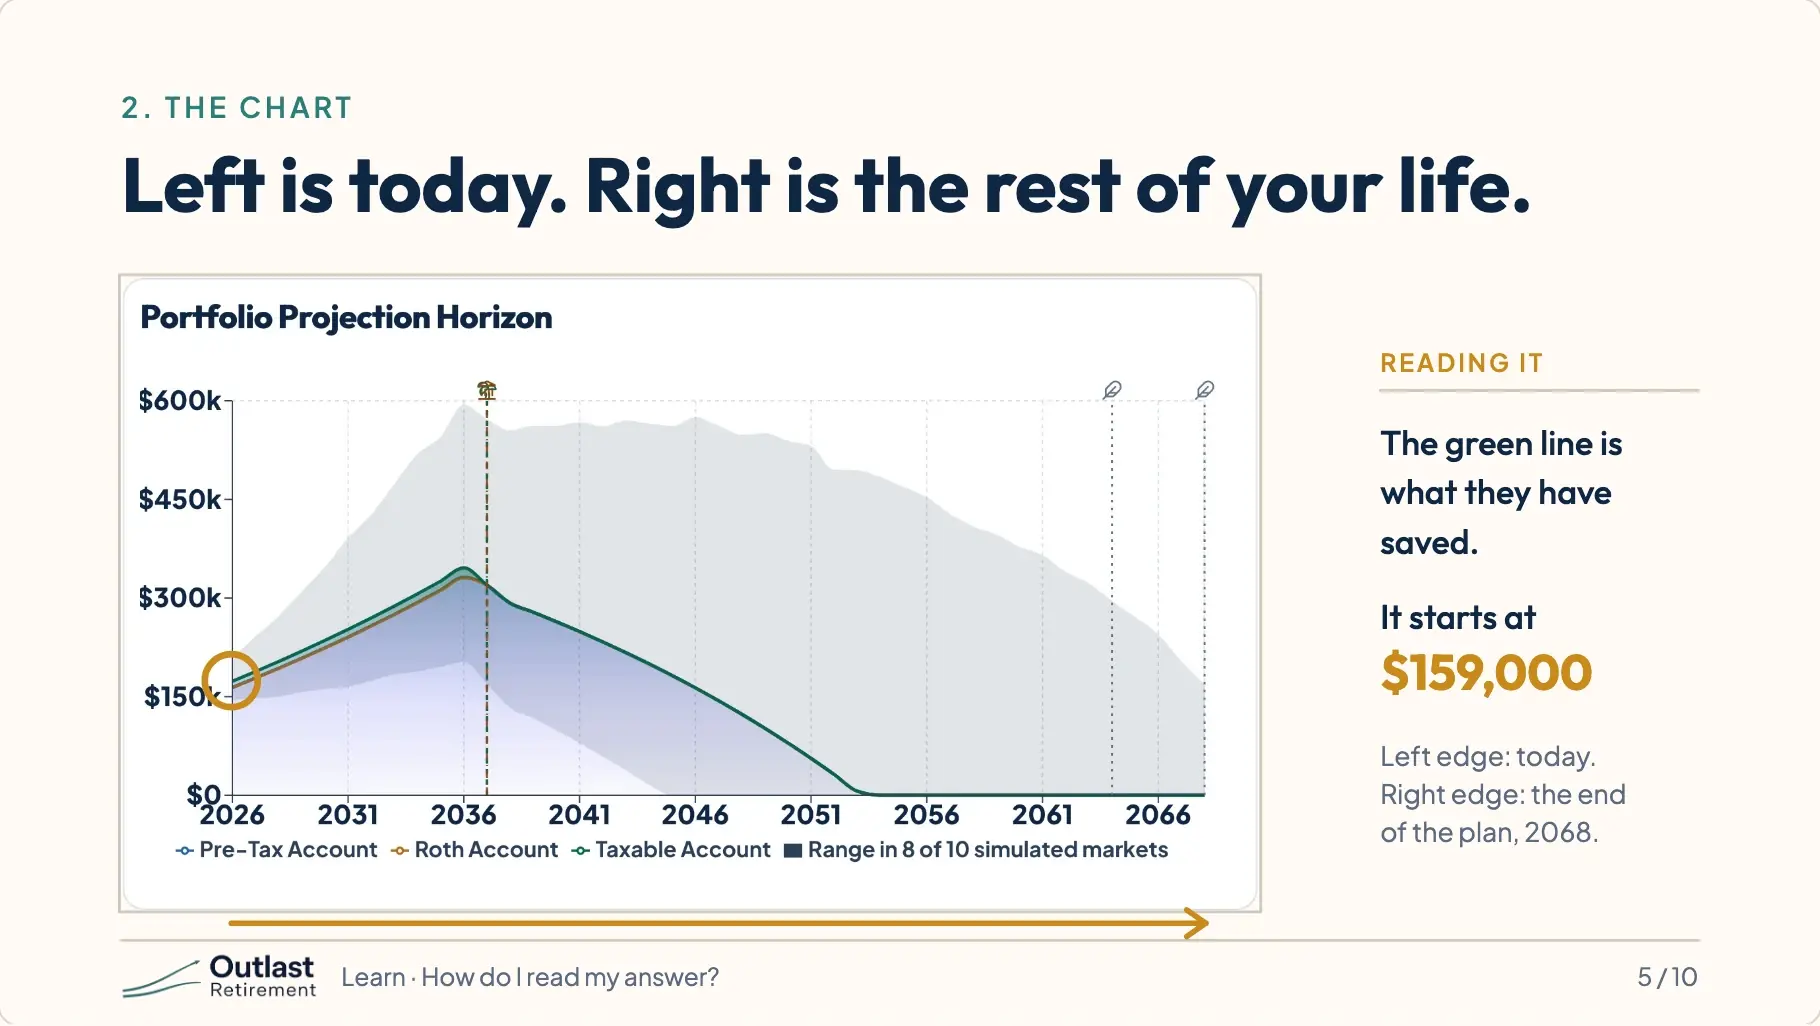
Now the chart. The left edge is today. The right edge is the end of the plan. The height of the green line is how much you have saved. Ray and Angie start at one hundred fifty-nine thousand dollars.
6.The top of the hill
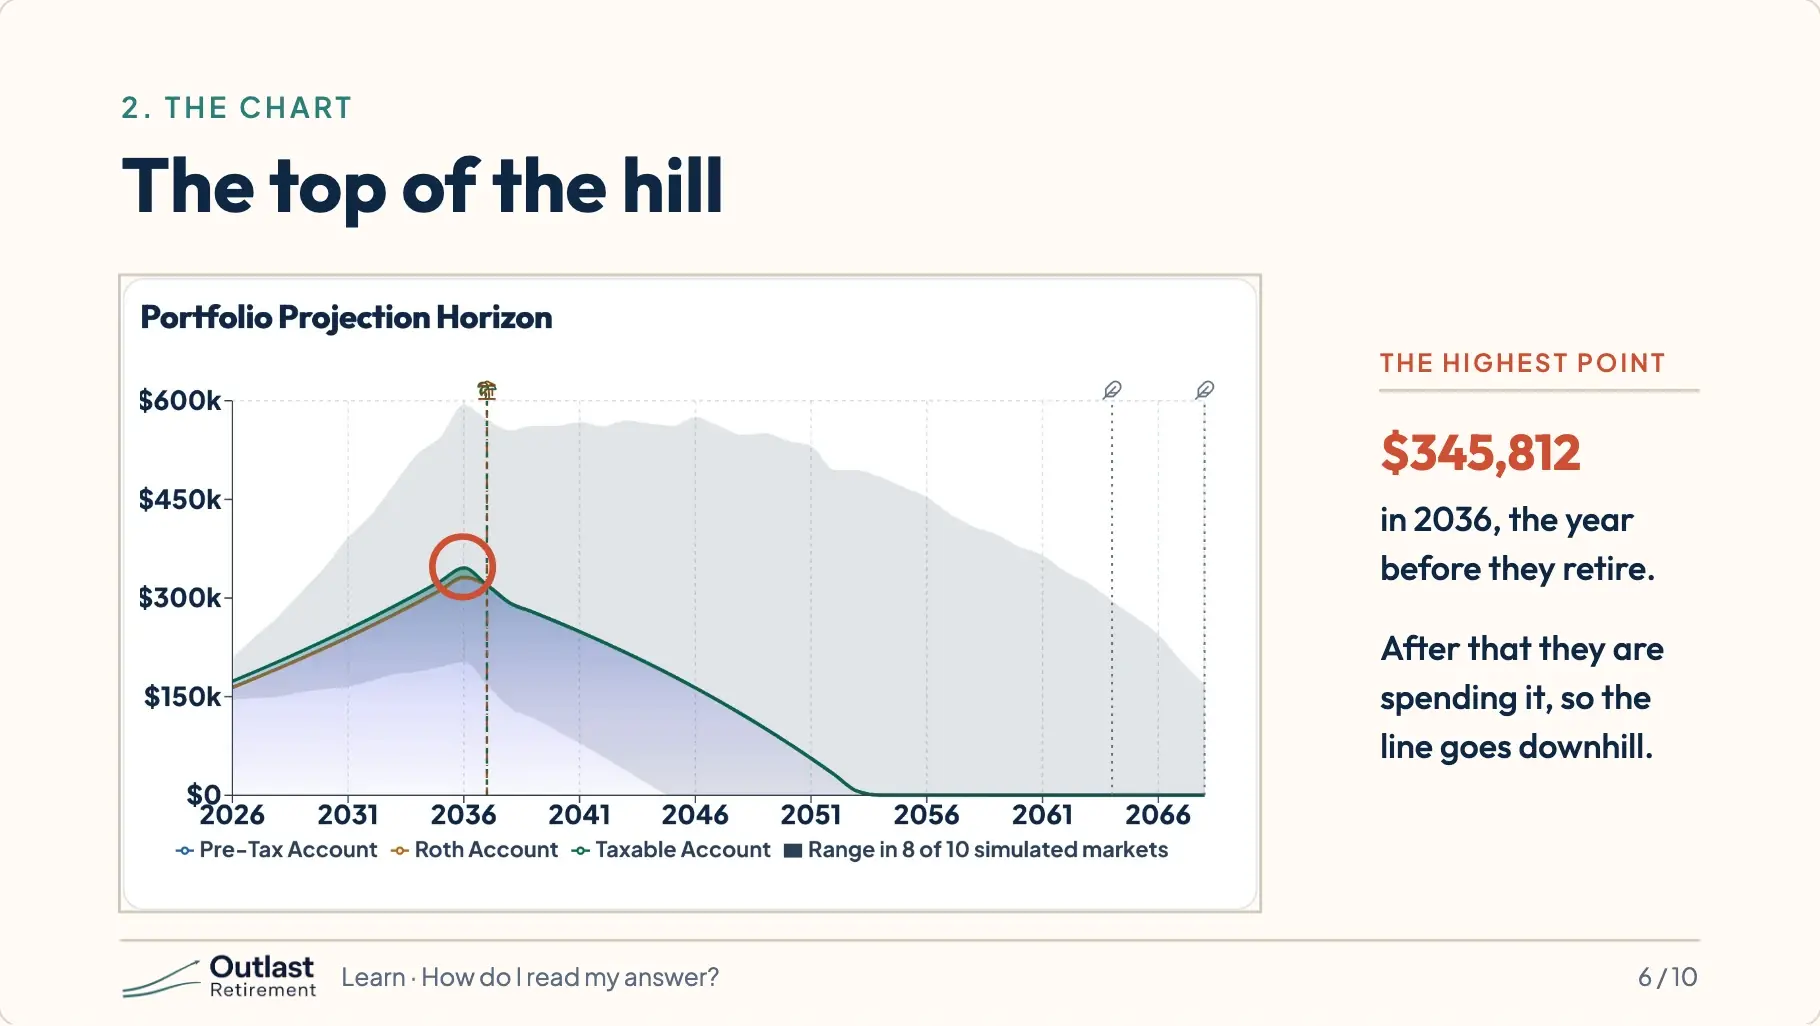
The line climbs while they work. The highest point is the year before they retire: about three hundred forty-six thousand dollars. From there it goes downhill, because now they are spending it.
7.Where the line touches the floor
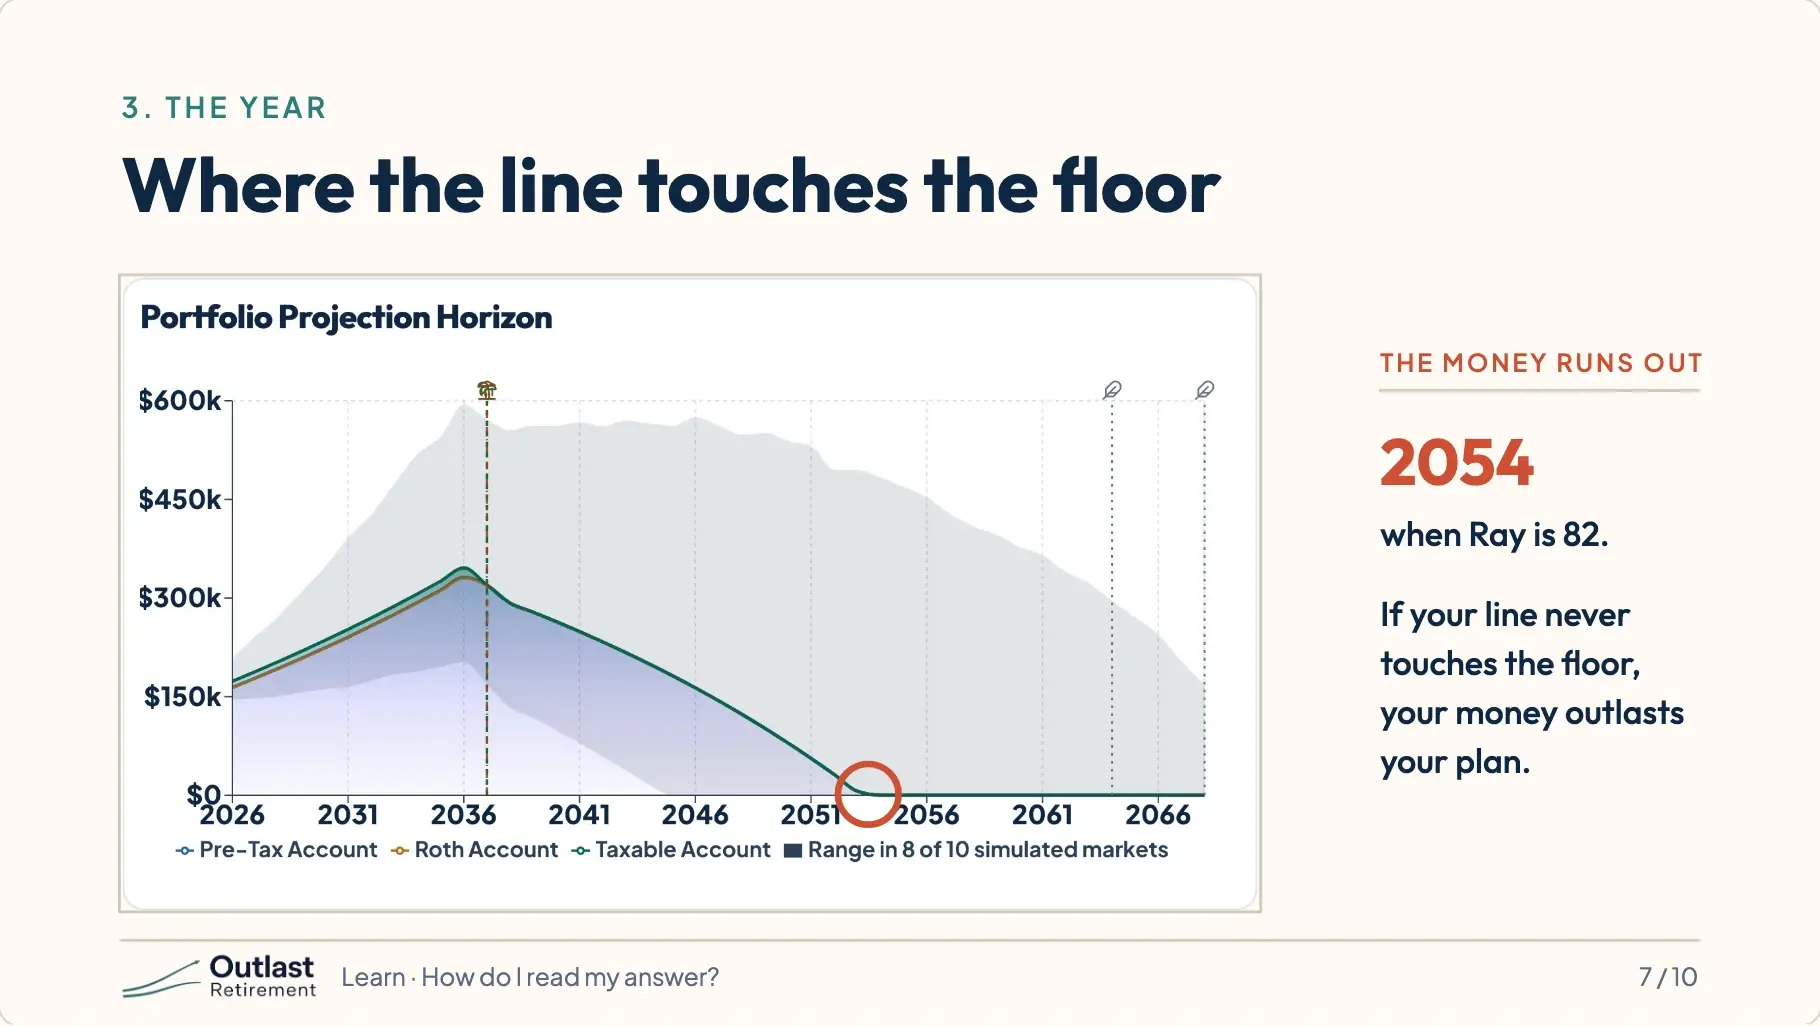
Follow the line down. Where it touches the floor is the year the money runs out. For Ray and Angie that is 2054, when Ray is 82. If your line never touches the floor, your money outlasts your plan.
8.The gray band
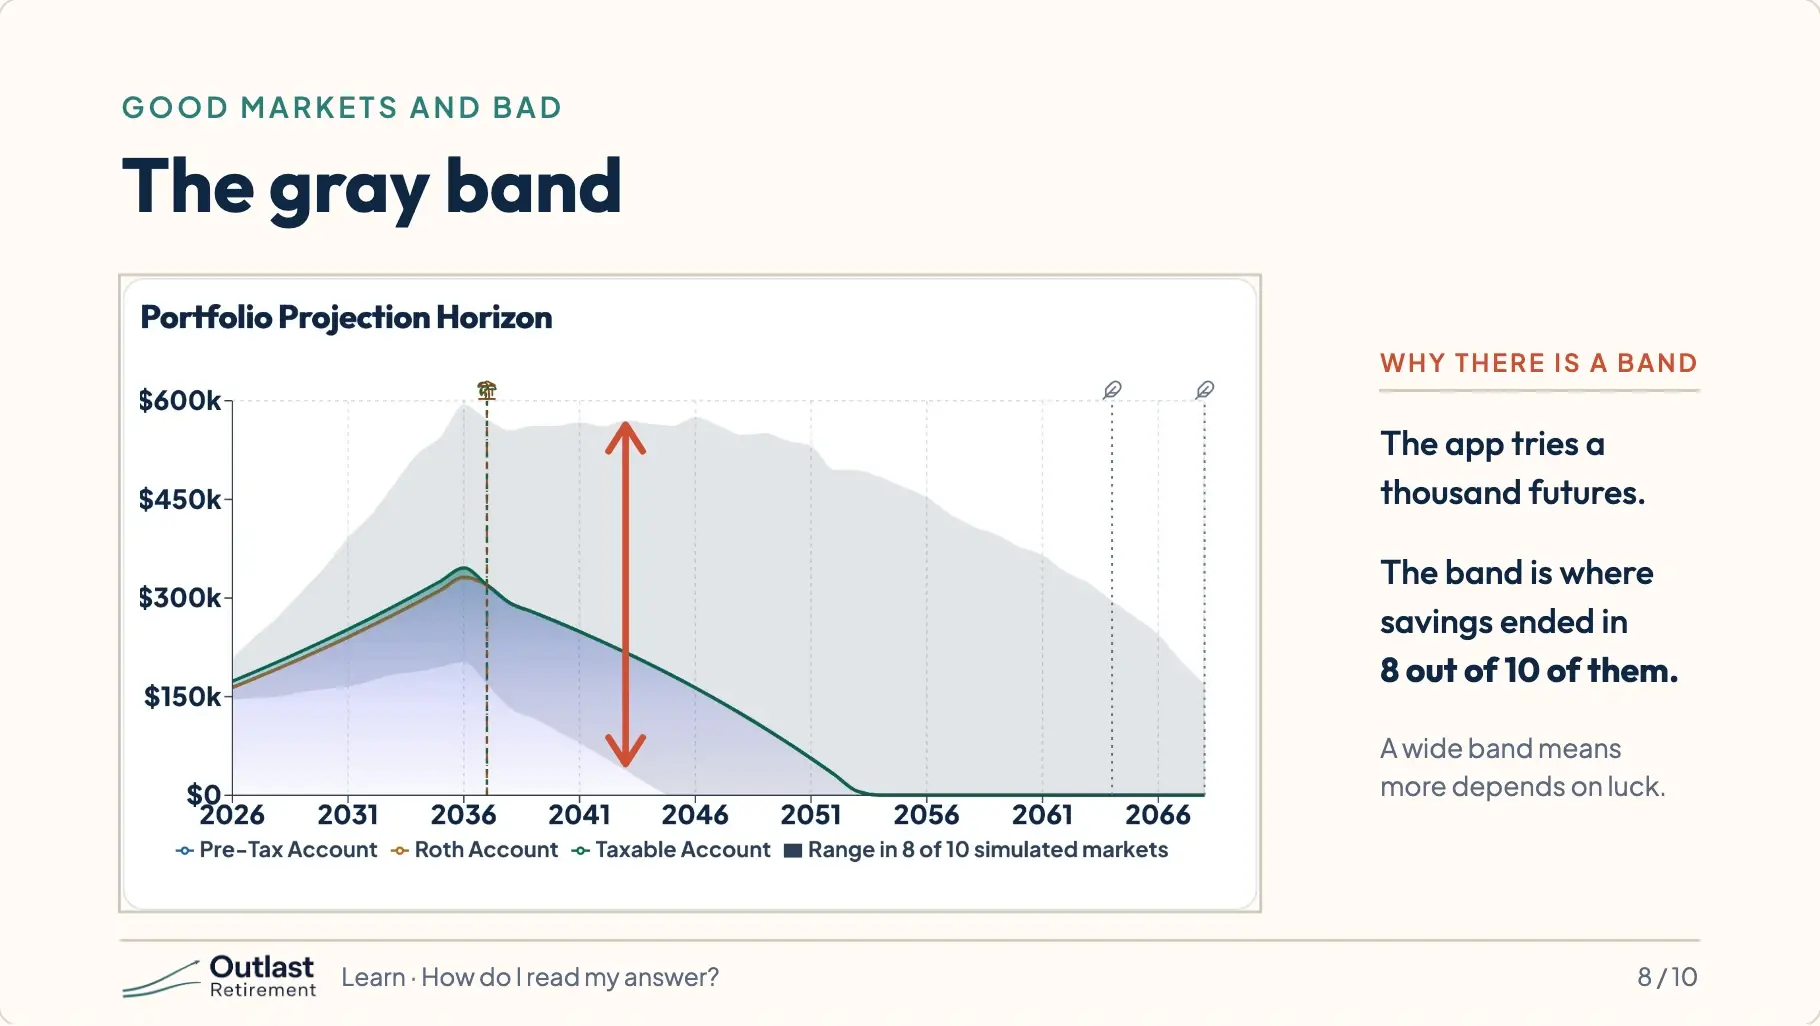
Notice the gray shape around the line. Nobody knows what the markets will do. The app tries a thousand different futures. The gray band is where savings ended up in eight out of ten of them. A wide band means a lot depends on luck.
9.Read the sentence under the chart
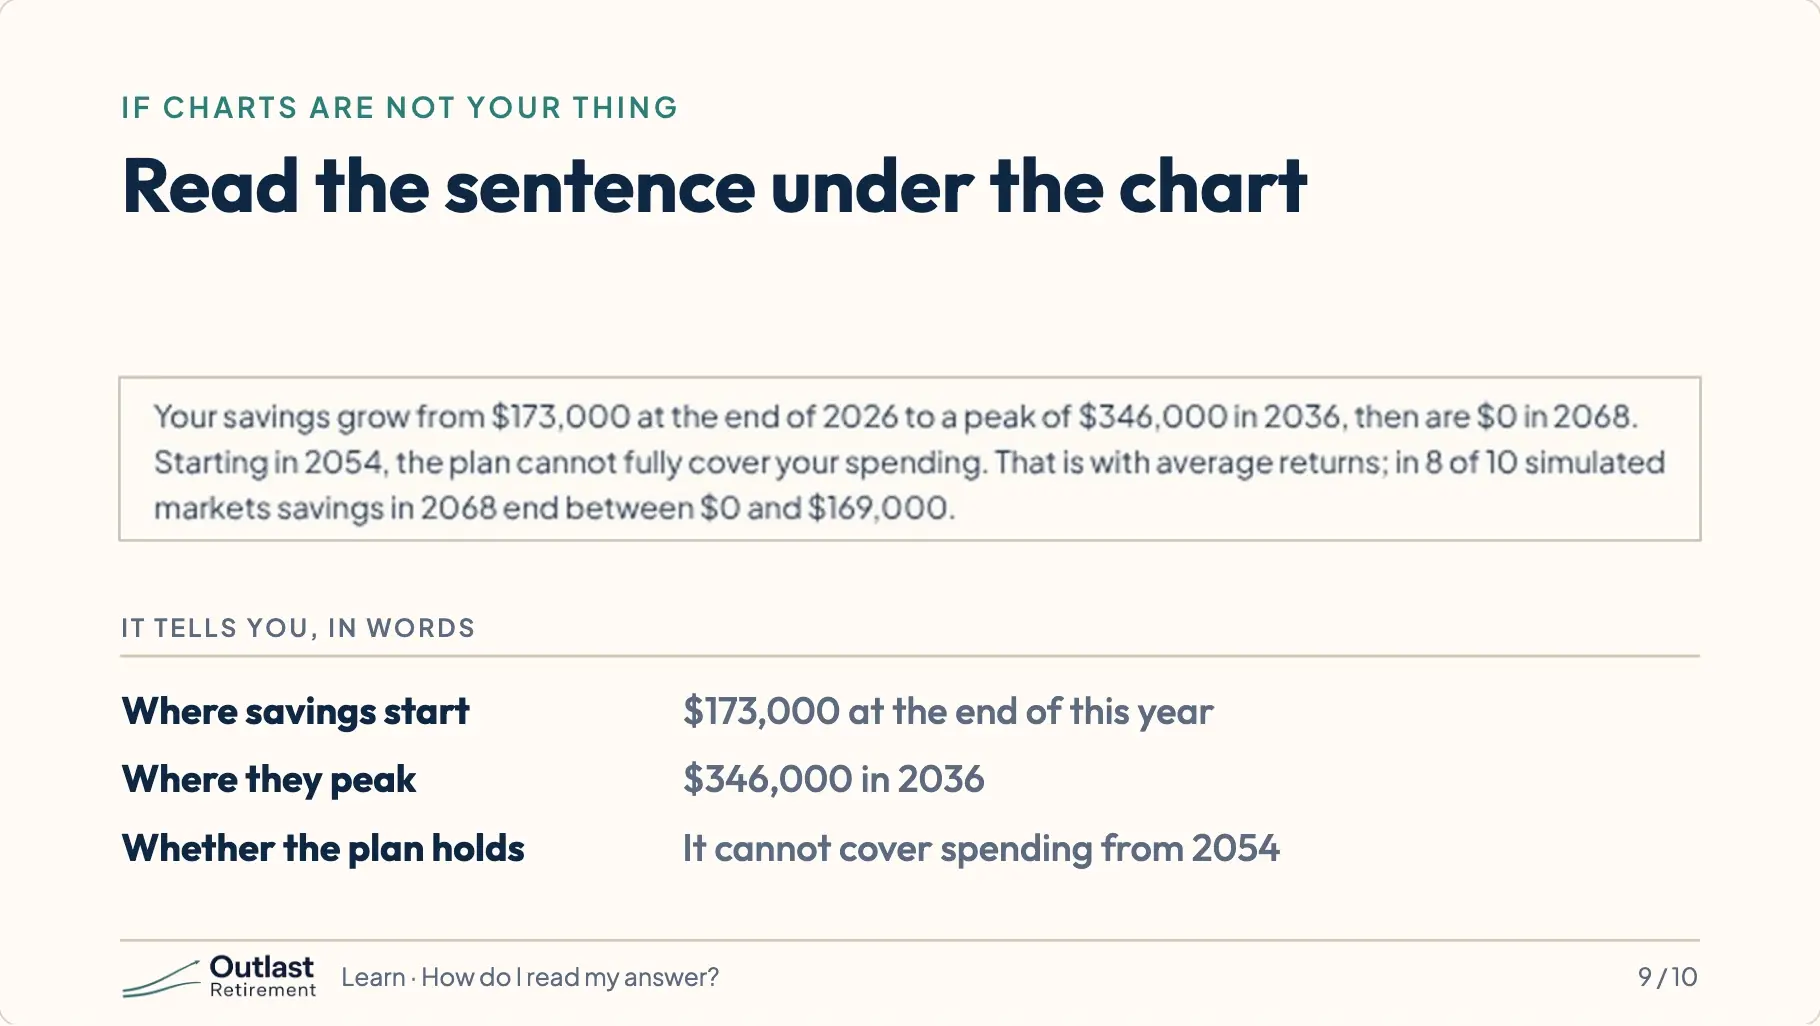
If charts are not your thing, read the sentence underneath. It says the same thing in words: where savings start, where they peak, and whether the plan covers your spending.
10.Find your verdict, your peak, your year
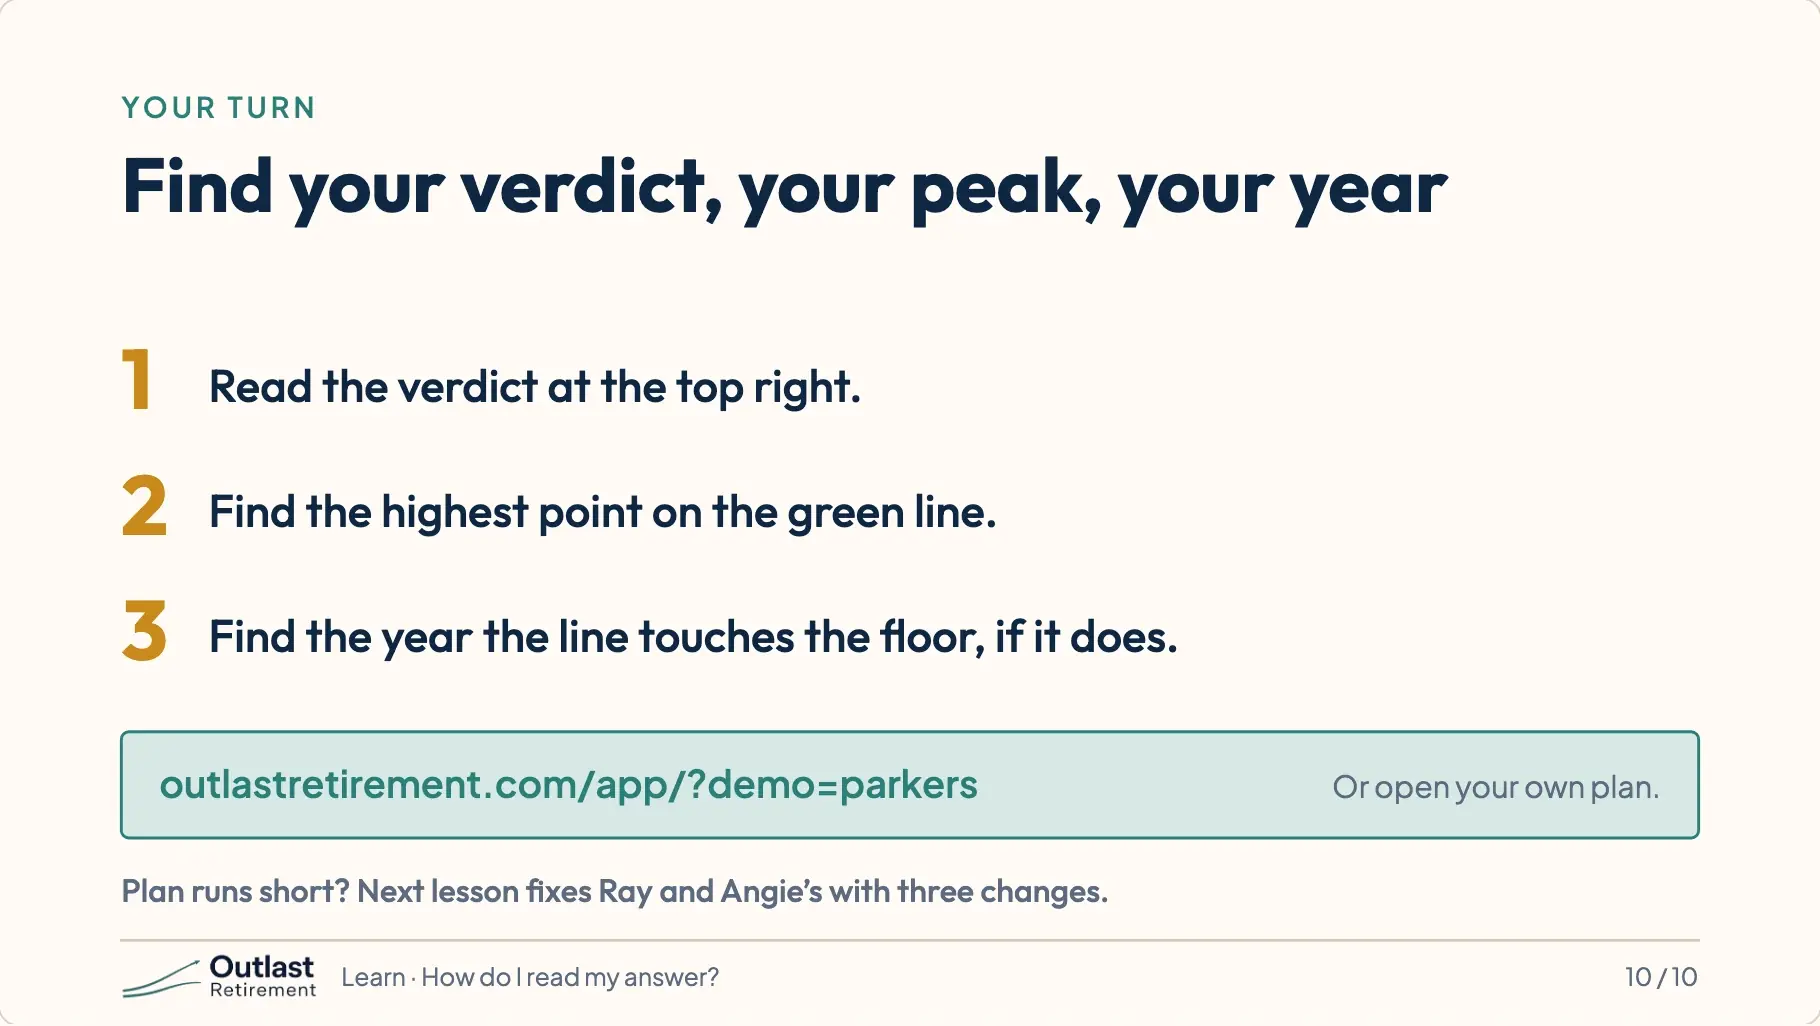
Your turn. Open your own plan, or Ray and Angie’s. Find three things. The verdict. The highest point on the line. And the year the line touches the floor, if it does. If your plan runs short, you are in good company, and the next lesson is for you. We fix Ray and Angie’s plan with three changes. This is education, not financial advice.
Try it
Ray and Angie’s plan opens with every number already filled in. Nothing you change there is saved, and it does not touch a plan of your own.
Open Ray and Angie’s plan