

How a plan follows your savings, year by year, and arrives at one answer.
This is an educational walkthrough using a fictional family. It is not financial advice, and the right answers for you depend on facts a lesson cannot know.
Watch this lesson (4 minutes) Opens YouTube in a new tab.
1.Will my money last?
Here is the question this whole course answers. If you keep doing what you are doing today, will your money last as long as you do?
2.Education, not advice
One thing first. This is an educational walkthrough using a fictional family. It isn’t financial advice, and the right answers for you depend on facts a lesson can’t know.
3.Meet Ray and Angie Parker
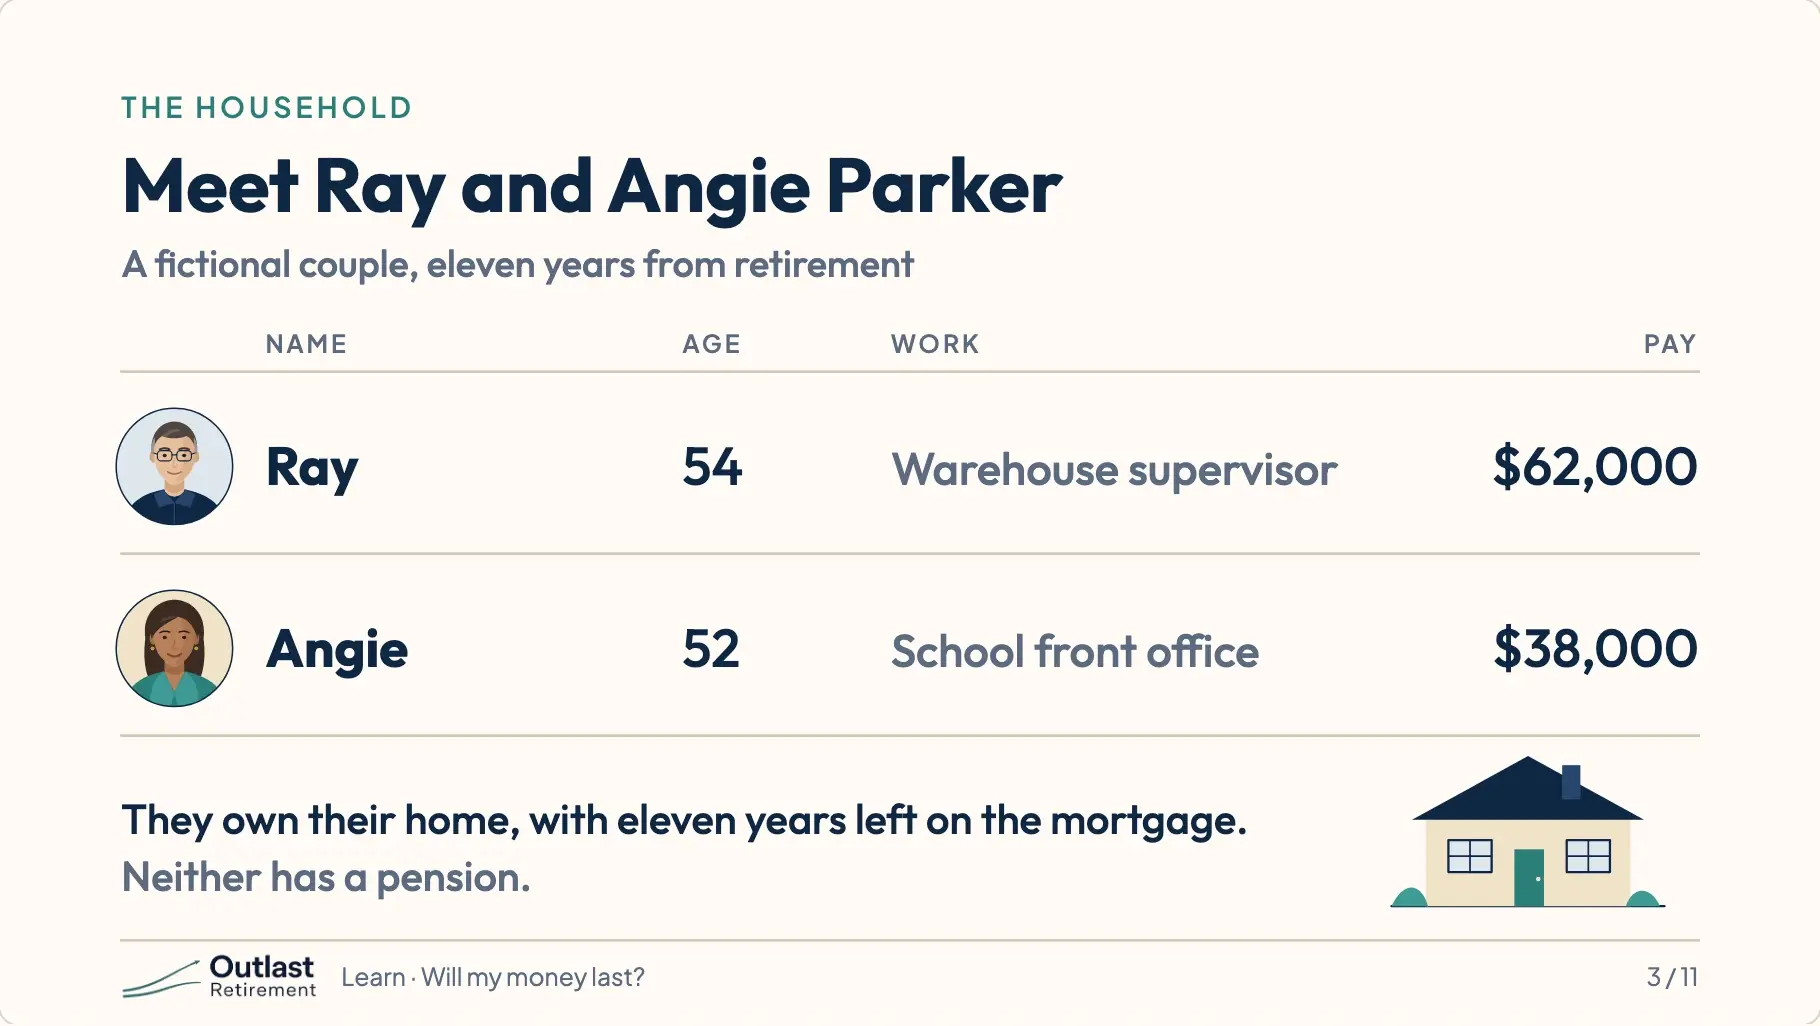
Meet Ray and Angie Parker. Ray is 54 and runs a warehouse shift. Angie is 52 and works in a school office. They own their home and still have eleven years left on the mortgage. We made them up, so we can show you every number.
4.What they have saved
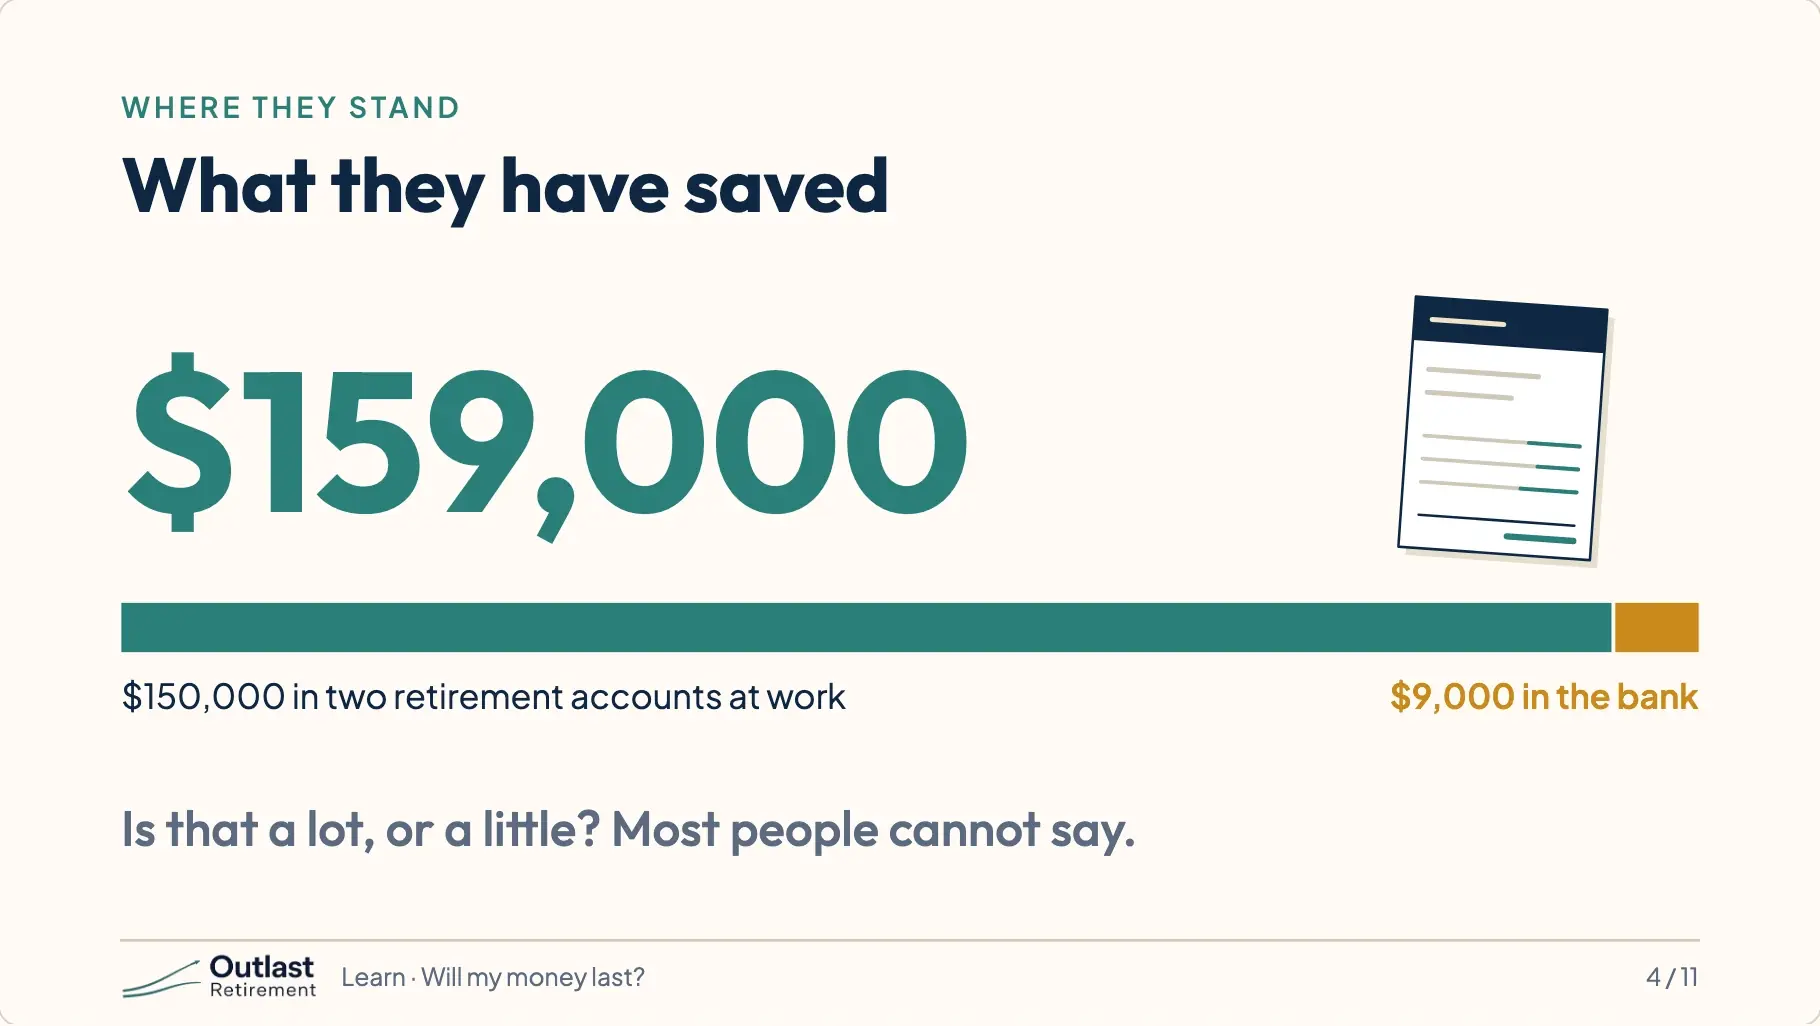
Between two retirement accounts at work and a savings account, they have put away one hundred fifty-nine thousand dollars. They don’t know if that is a lot or a little. Most people don’t.
5.A plan follows one balance
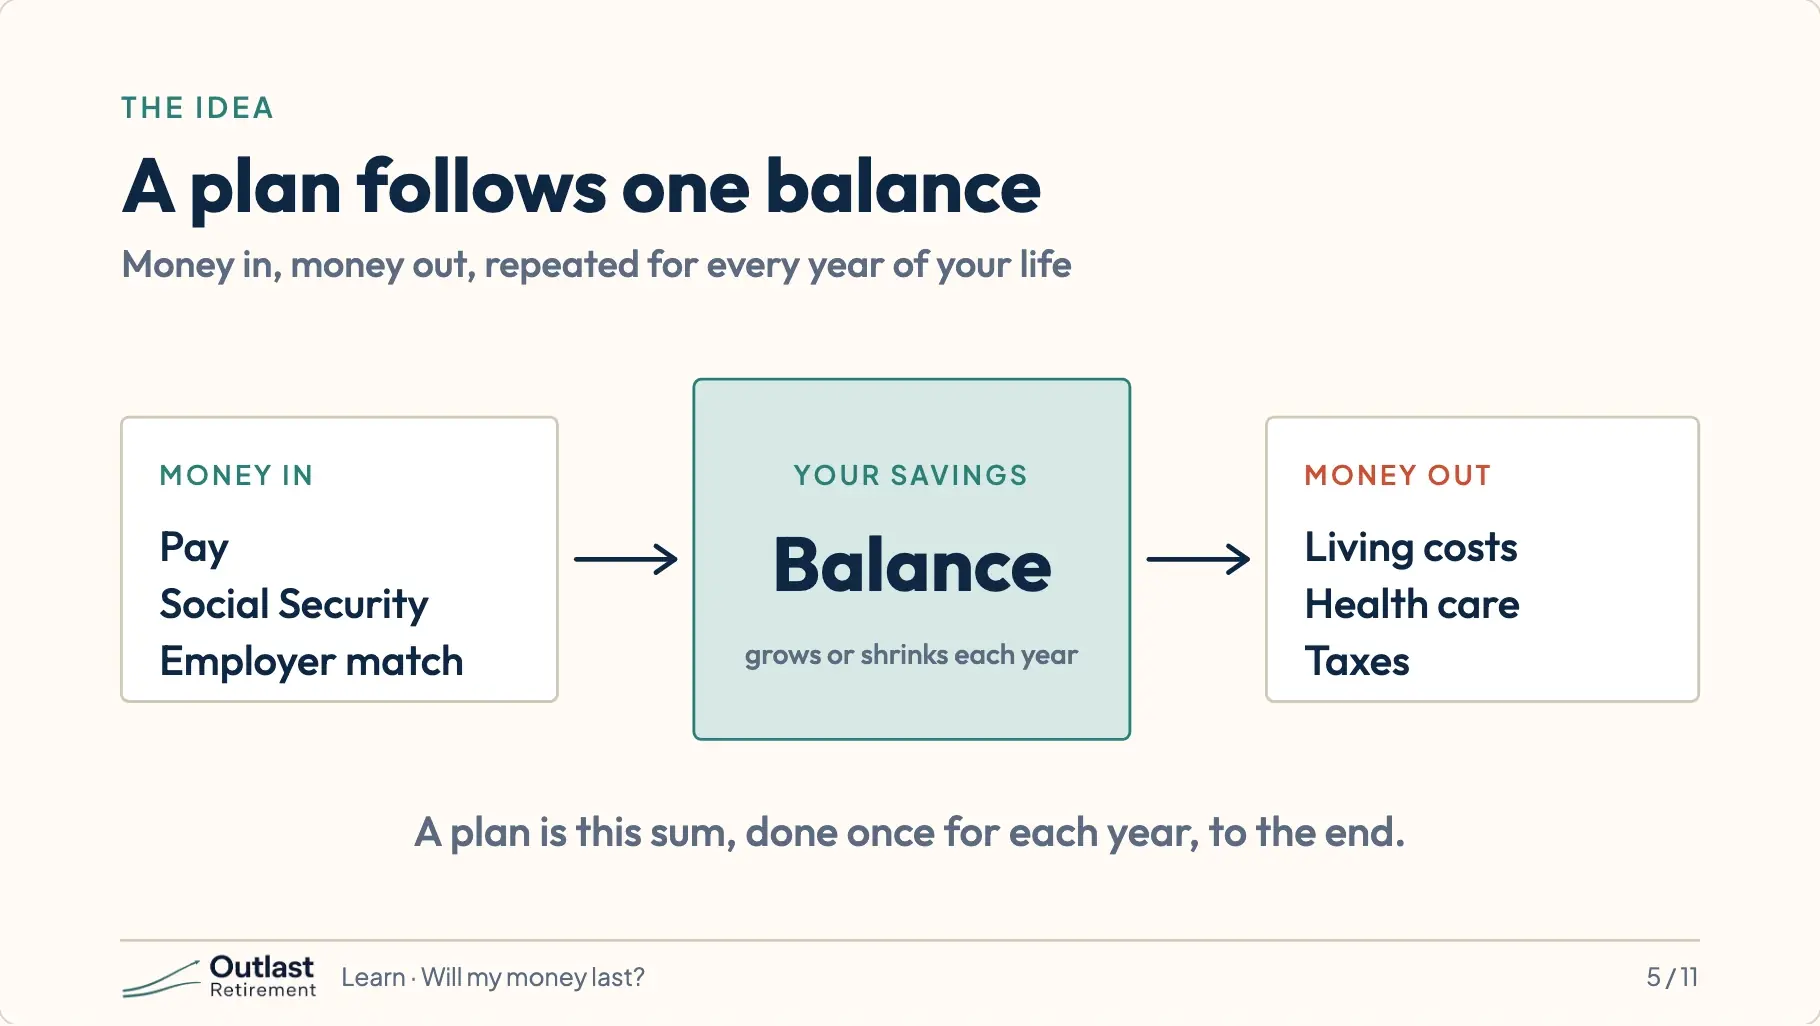
A retirement plan sounds complicated. It isn’t. Think of your savings as one balance. Some years money goes in. Some years money comes out. A plan just follows that balance, one year at a time, for the rest of your life.
6.While they work, the balance grows
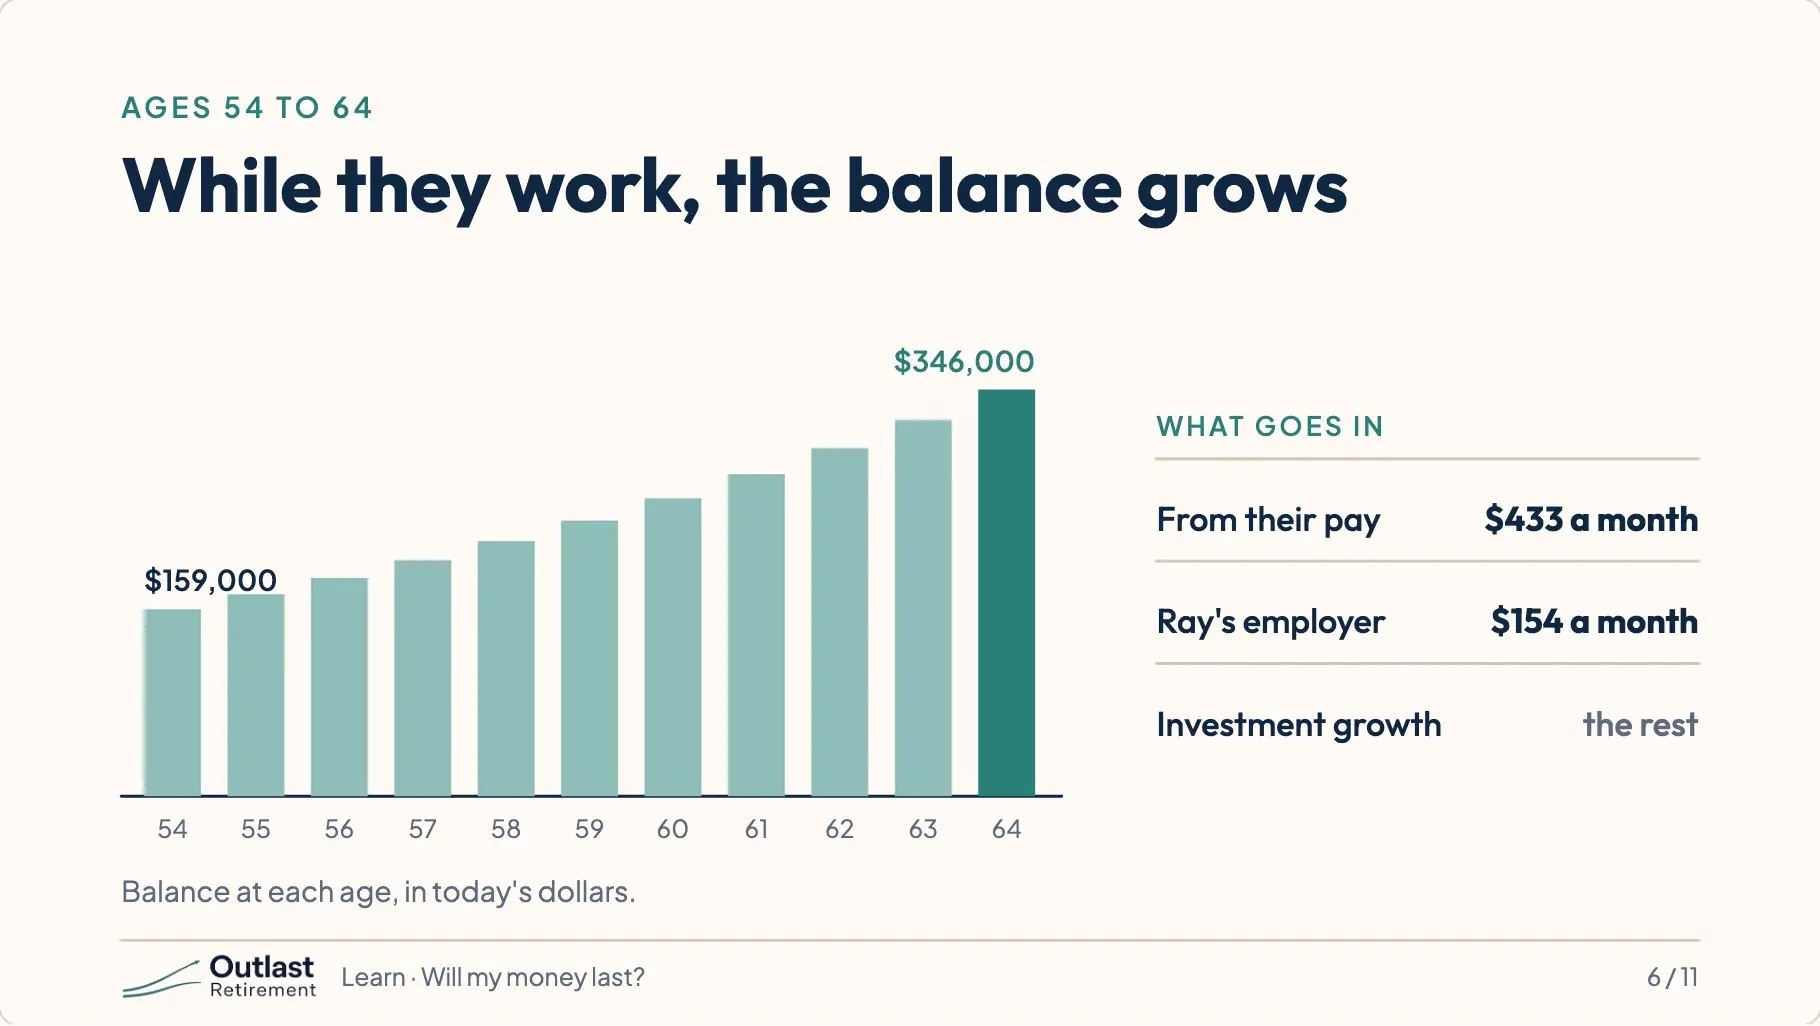
While Ray and Angie work, the balance grows. Each month a little of their pay goes in. Ray’s employer adds some too. And the money already saved earns more money by being invested.
7.At 65, the paycheck stops
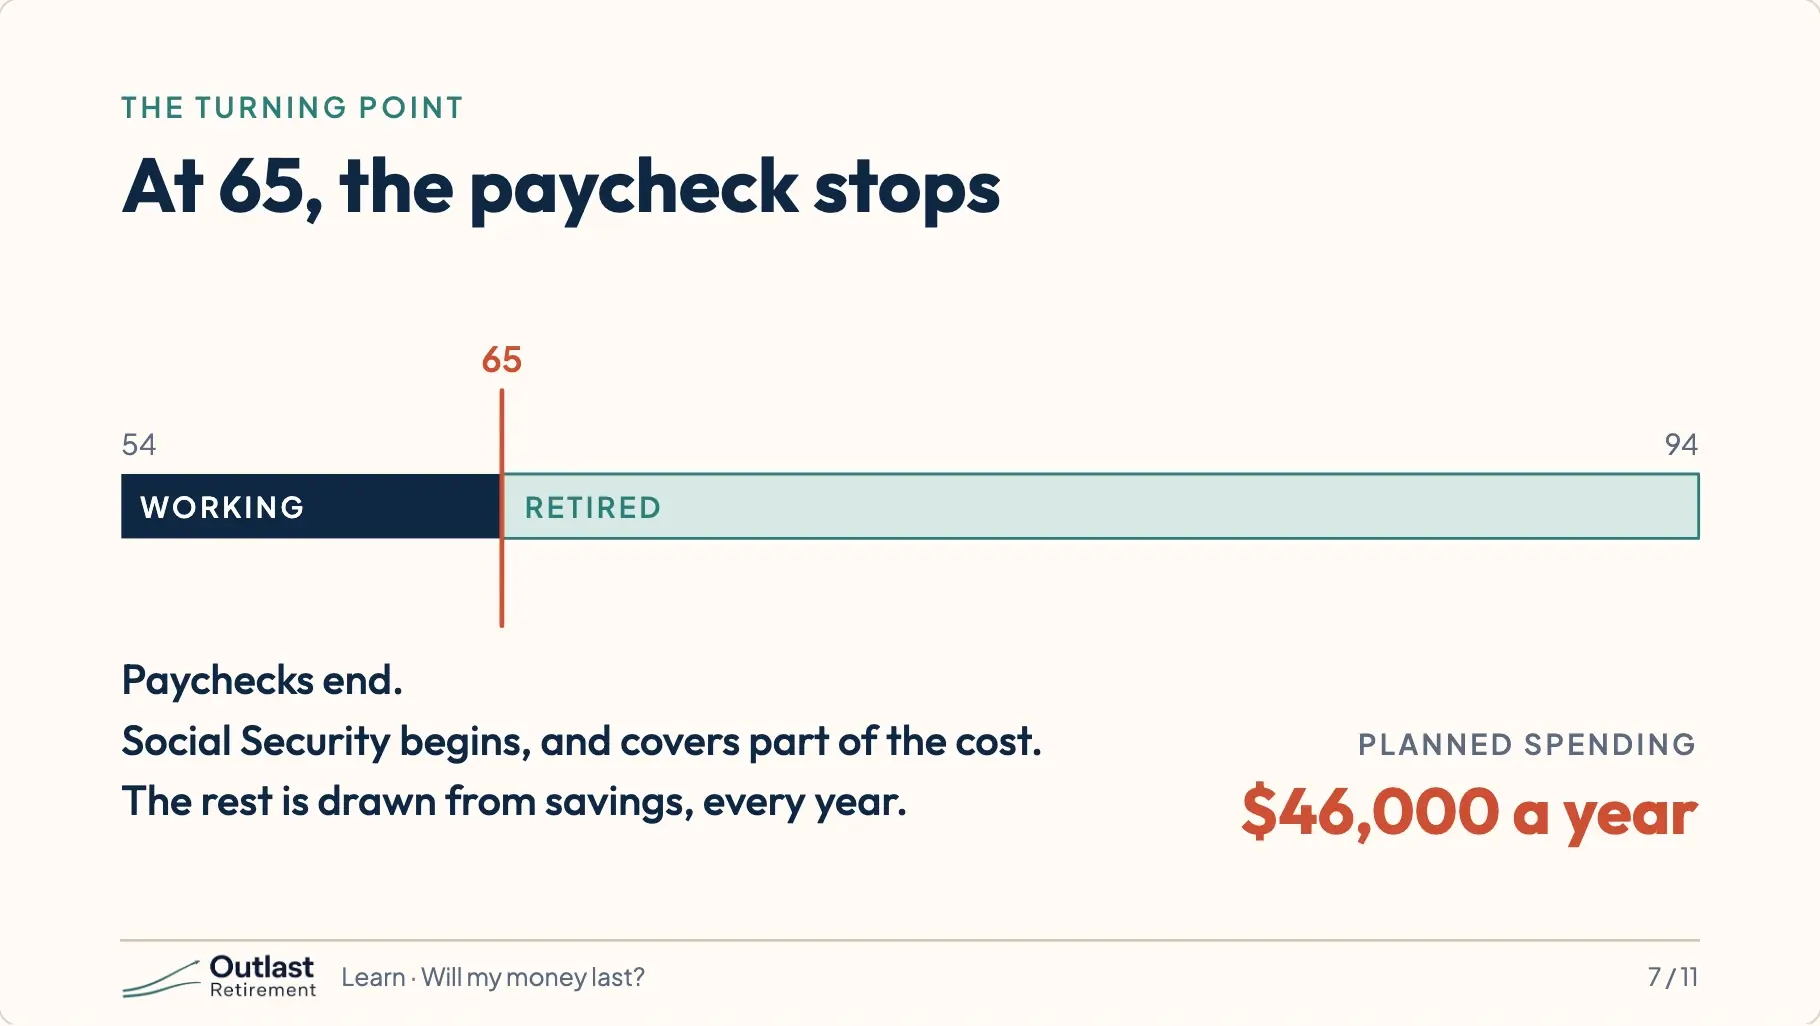
They plan to stop working when Ray turns 65. The paychecks end. Social Security starts, but it does not cover everything. Each year, the rest comes out of their savings. They plan to live on forty-six thousand dollars a year.
8.The Parkers’ savings, year by year
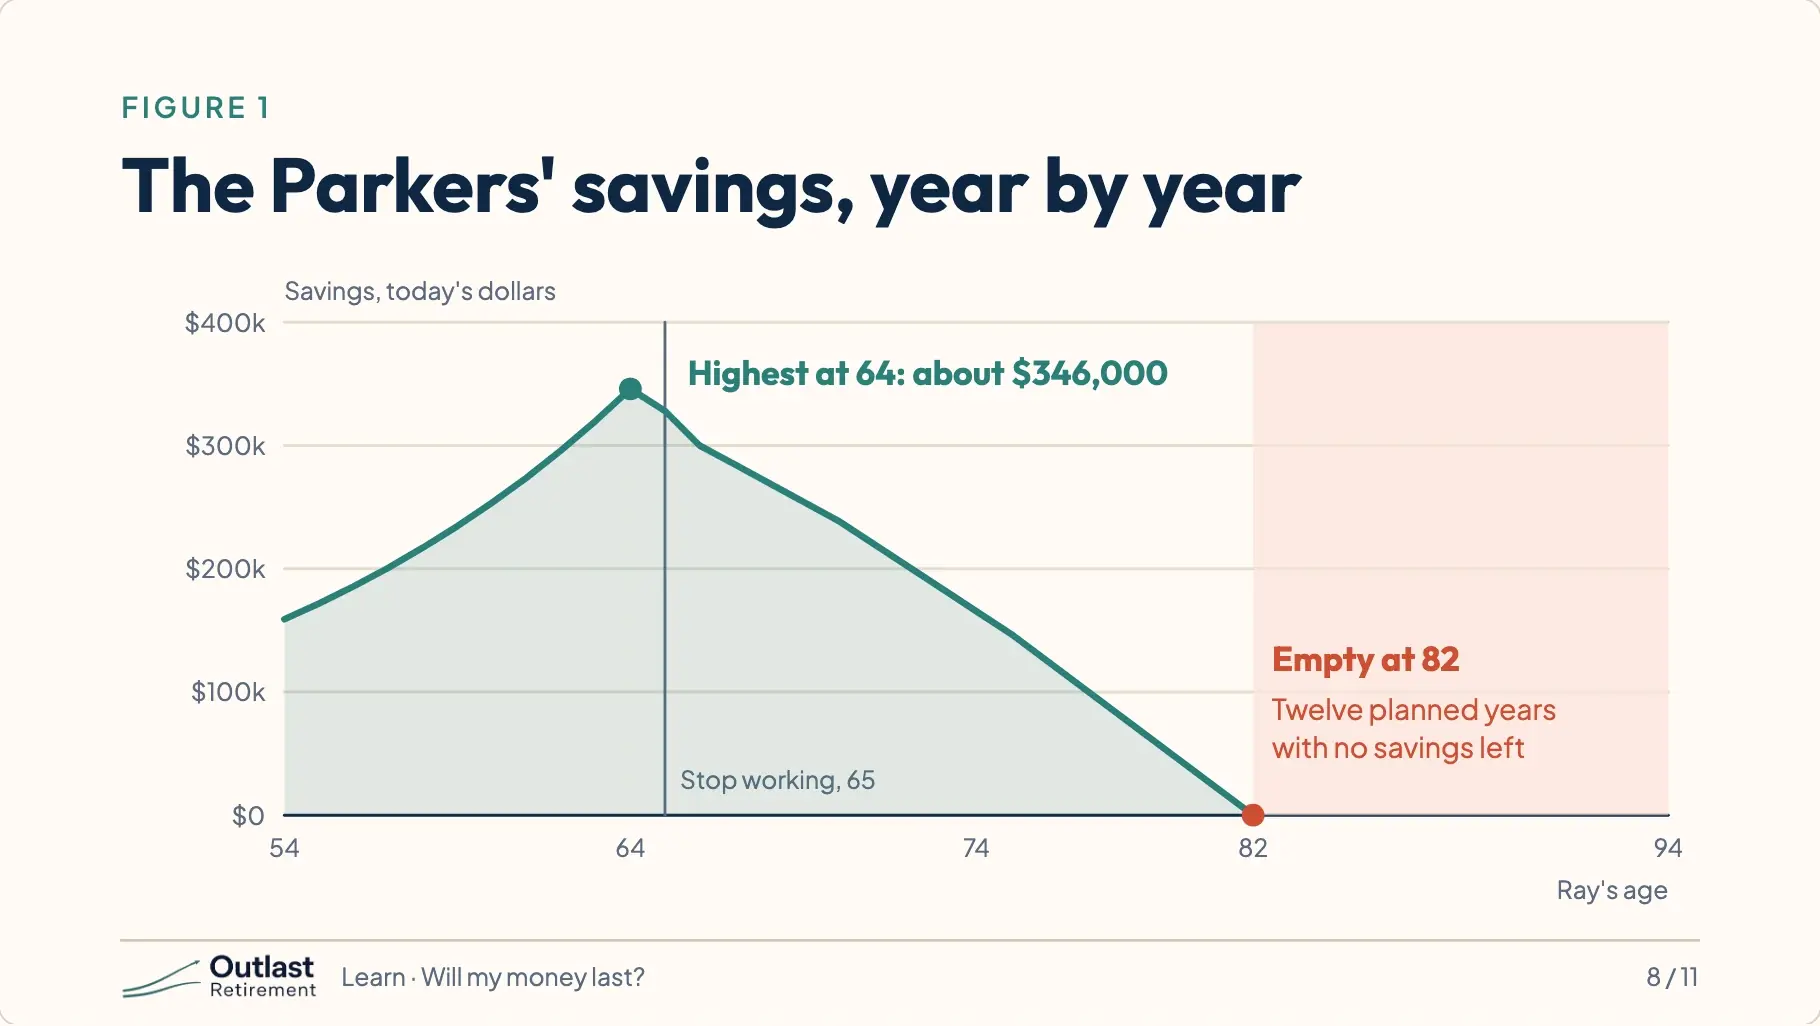
Here is their balance over time. It climbs while they work and reaches about three hundred forty-six thousand dollars. Then they stop, and it starts to fall. When Ray is 82, it is empty. He and Angie could easily live another ten years.
9.The answer, in plain words
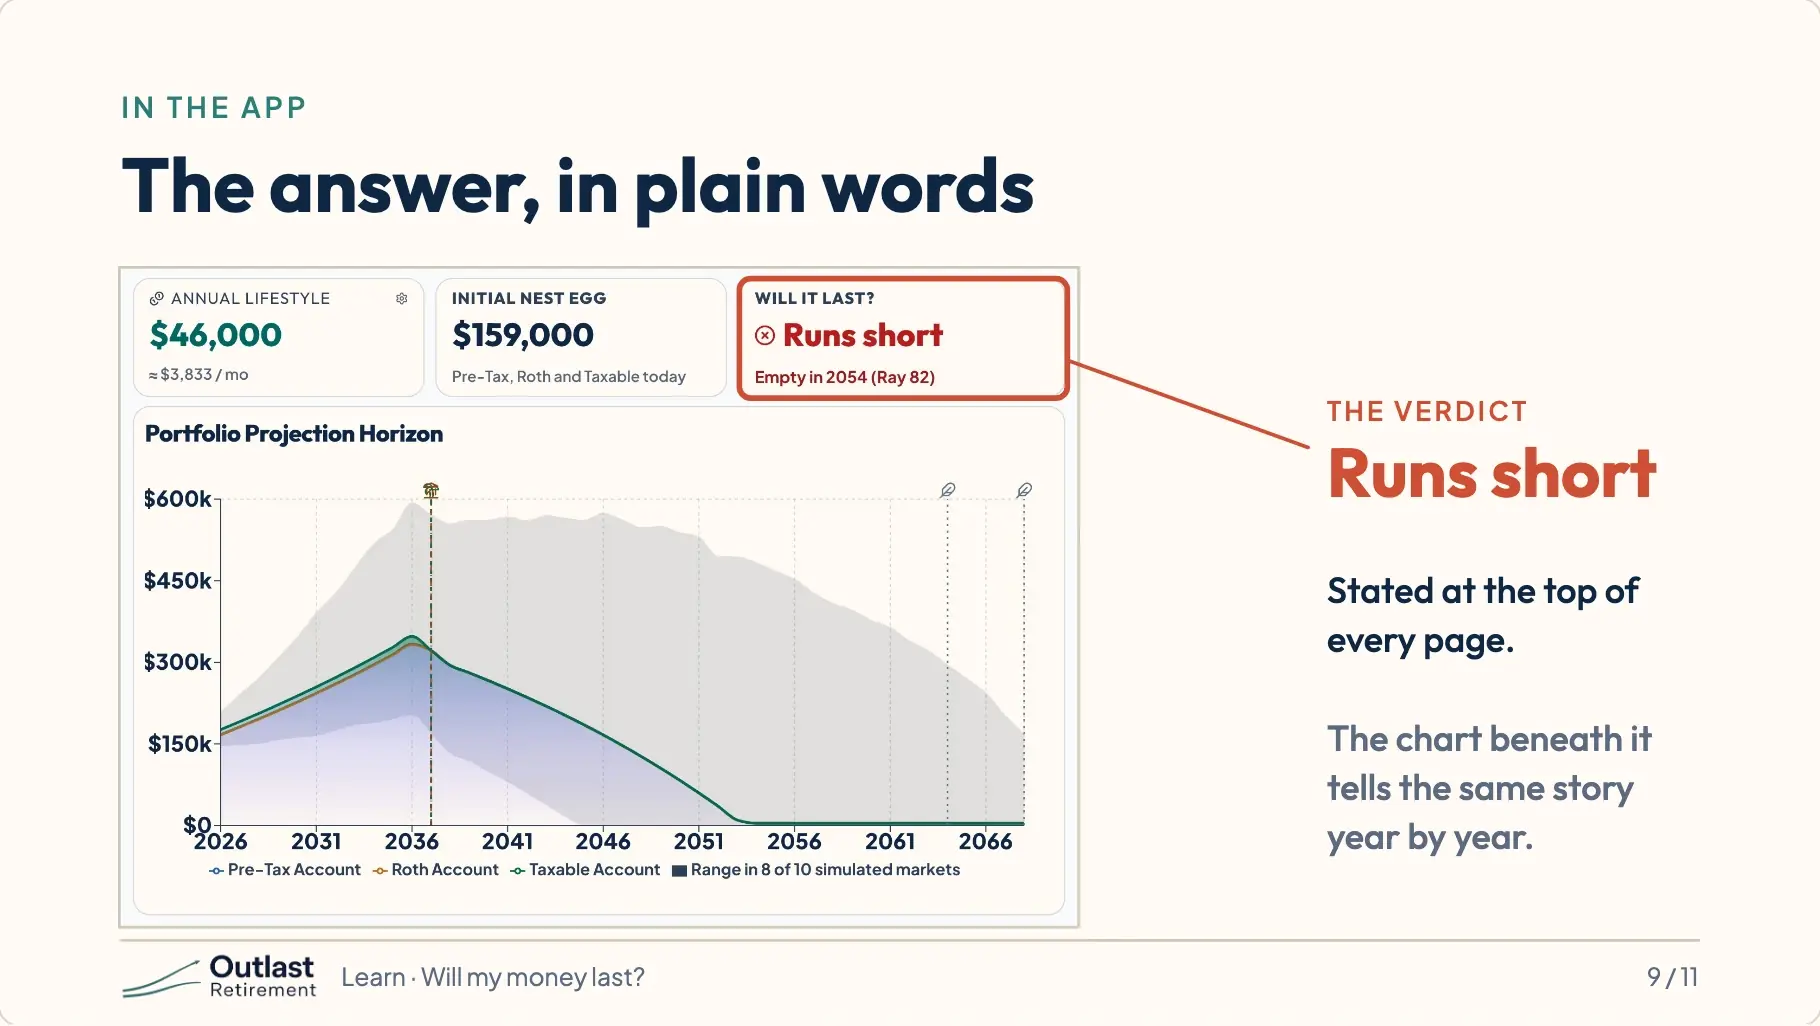
This is the same family inside OutlastRetirement. You don’t have to read a chart to get the answer. It is written in plain words at the top: runs short. Under it, the chart shows the same story you just saw, and the year the money runs out.
10.This is good news
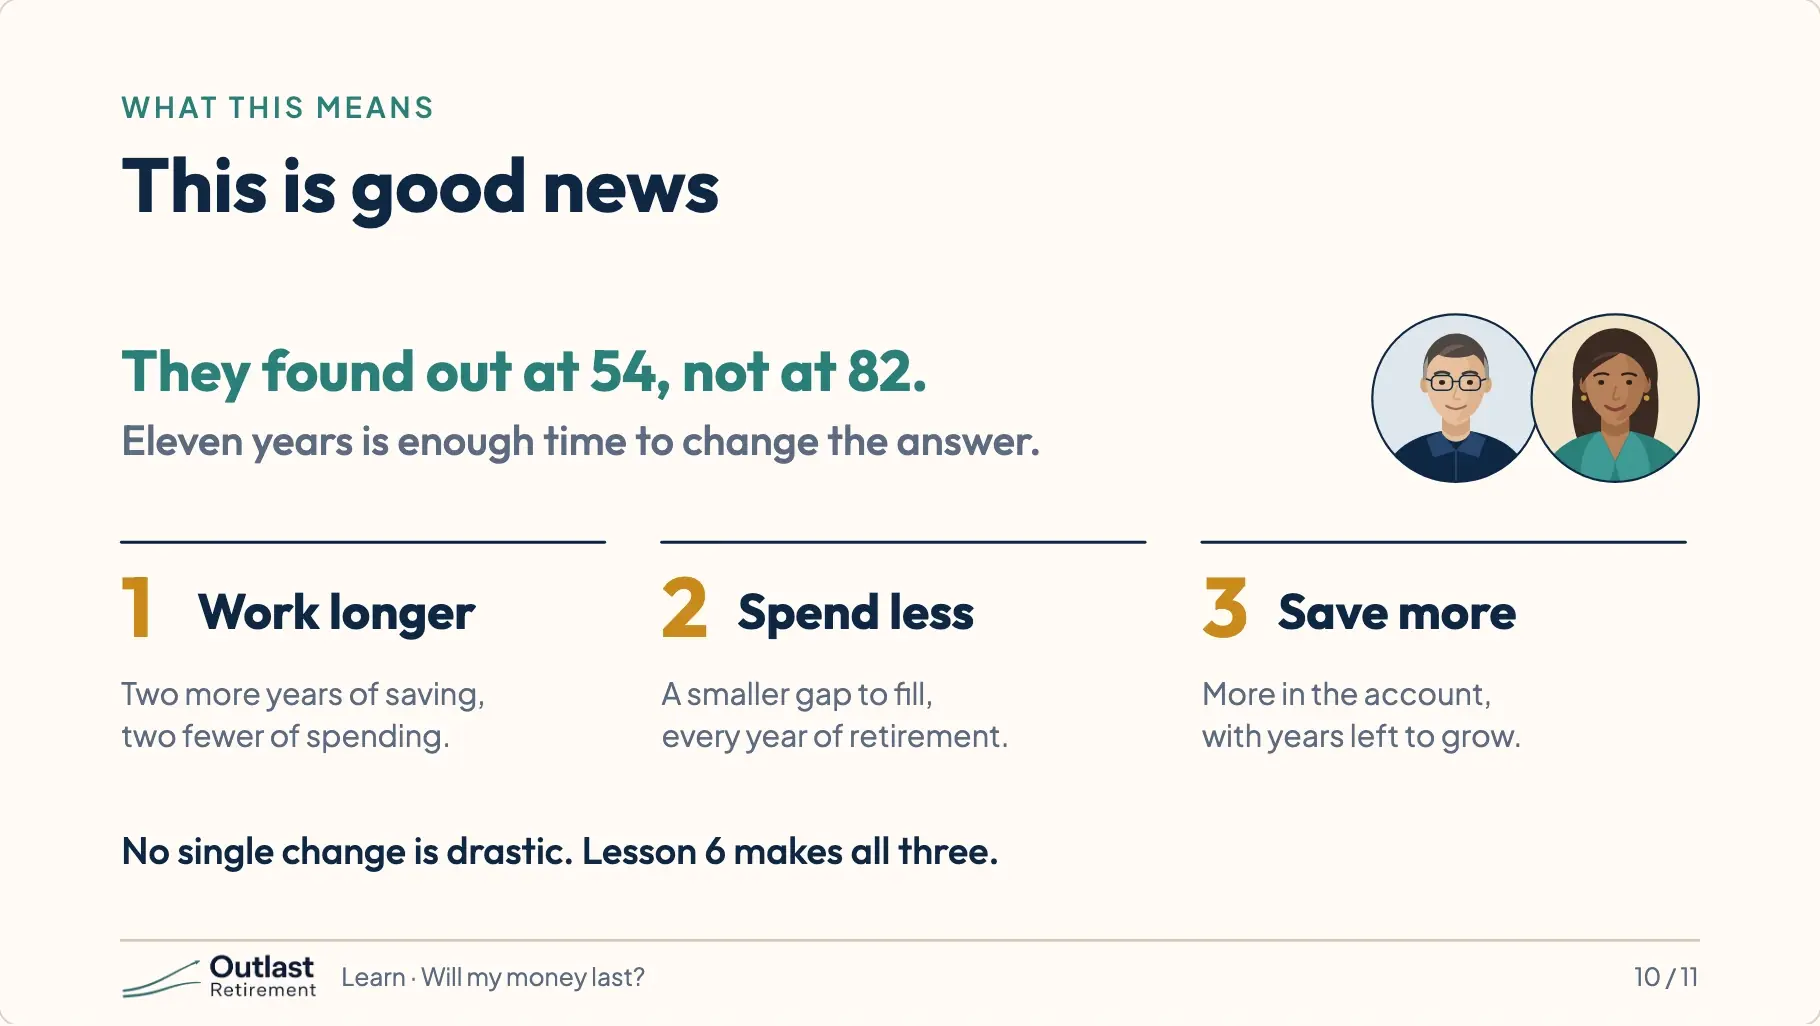
That sounds like bad news. It is the opposite. Ray and Angie just found out with eleven years left to do something about it. A few changes, none of them drastic, fix their plan. We will make those changes together in lesson six.
11.Your turn: open the Parkers’ plan
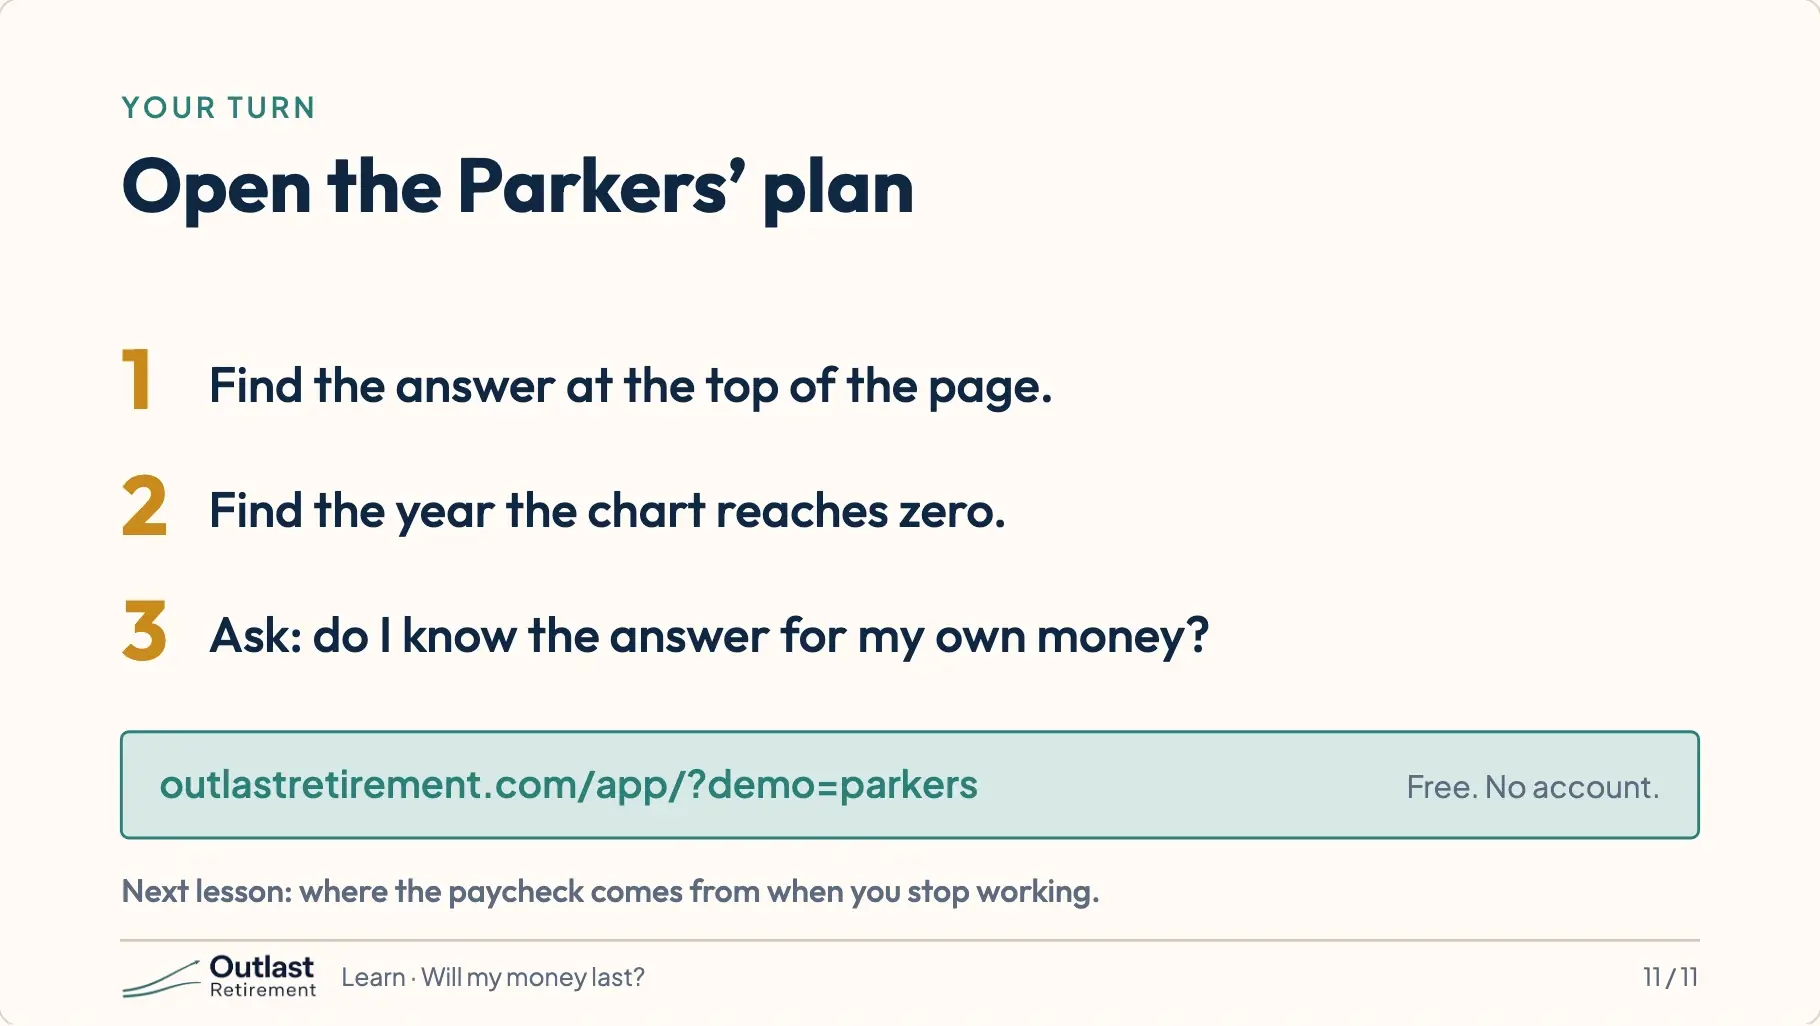
Now you try. Open Ray and Angie’s plan with the link below. Find the answer at the top of the page. Then find the year the chart reaches zero. Nothing you click can break anything, and it is free. And ask yourself one question: do you know the answer for your own money? Next time: where the paycheck comes from when you stop working. As always, this is education, not financial advice.
Try it
Ray and Angie’s plan opens with every number already filled in. Nothing you change there is saved, and it does not touch a plan of your own.
Open Ray and Angie’s plan